Cross-Well Fracking Monitoring

Low-frequency strain acquired from cross well optical fiber installations provides robust information on fracture growth within the target reservoir.

Services

Reliable & Innovative Cross-Well Monitoring

Low-frequency strain acquired from cross well optical fiber installations provides robust information on fracture growth within the target reservoir. Understanding the key drivers behind inter-well fracture communication is critical for optimizing well position and fracture placement within a completion design program, ultimately maximizing resource recovery.

Contact Us
Maximize Your Crosswell Strain Data

Our cross-well monitoring solutions provides information on:

  • Treatment volume to fracture hit
  • Fracture growth over time
  • Fracture azimuth
  • Time dependent fracture width calculated at the fiber location
Evaluation

Fracking Efficiency Evaluation With Cross Well

Illustration of fracture communication between a treatment well and adjacent monitor well.

Where a hydraulic fracture intersects with the optical fiber (“frac hit”), the fiber experiences extension at the frac hit location, while the surrounding section undergoes compression (“stress shadowed”) as the fracture opens. By identifying frac hits at the monitor well and associating them with treatment stages from the injection well, we gain the ability to:

  • Evaluate the occurrence and timing of cross-well communication
  • Optimize well positioning and spacing
  • Evaluate the prescribed completion designs
  • Identify and assess the impact of geologic controls and features
Optimize

Timing, Location, and Frequency Insights to Optimize Systems

The cross-well strain data offers valuable insights into the timing, location, and frequency of fracture hits, enabling significant optimization opportunities, including
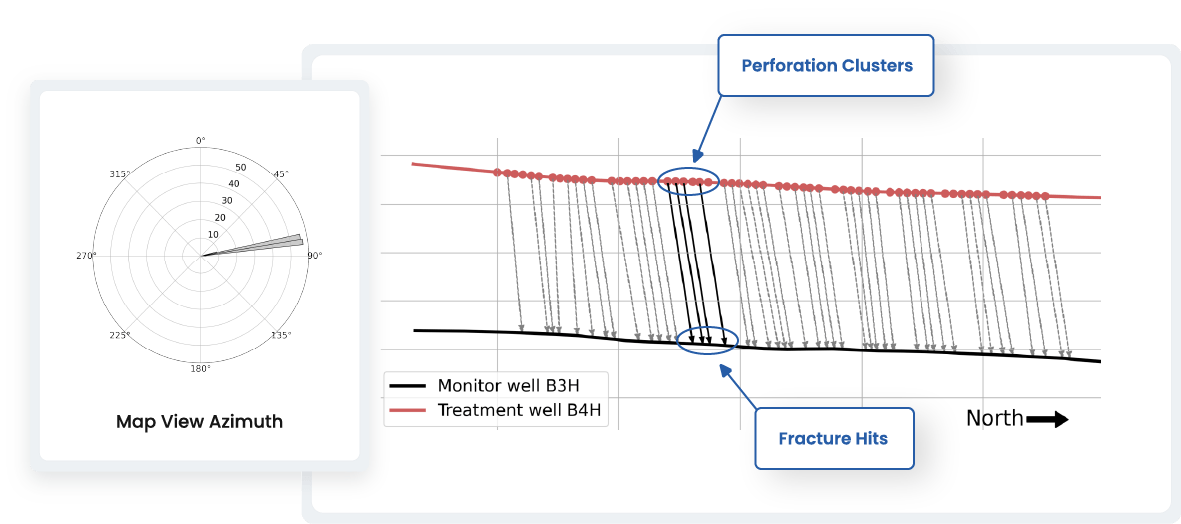
  • Determining dominant fracture network pathways (azimuth) to access the targeted treatment zone
  • Evaluating fracture network density to optimize design parameters such as cluster spacing and cluster number
  • Analyzing propagation velocity and treatment volumes to adjust fluid viscosity and pumping rate parameters

Interpreted Fracture Connection Map

Analysis

Quantitative Fracture Width Analysis

Our unique quantitative fracture width analysis offers advanced and actionable insights to optimize completion design programs. Applying our novel inversion algorithm, we can relate the strain change recorded at the monitor well with fracture induced rock deformations, enabling precise fracture width calculations.

  • Waterfall plot of strain rate measured along the monitor well during fracture propagation. Several newly created hydraulic fractures and reopened fractures during stimulation are identified.

  • Waterfall plot of the calculated strain using IFDATA’s novel inversion algorithm.

  • Fracture width results for each treatment stage, showing the widths of both newly created hydraulic fractures and reopened fractures.

What Can We Gain From This Analysis?

  • Confidently Evaluate Completion Design Efficiency

    Confidently evaluate completion design efficiency by integrating quantitative fracture width data with standard qualitative diagnostics

  • Assess The Impact on Fracture Geometry

    Assess the impact of geologic features, completion design variations, and reservoir properties on fracture geometry

  • Fine-Tune Treatment Parameters

    Fine-tune treatment parameters, such as proppant size and fluid volume, improving operational costs and reducing job duration

  • Enhance Production
    Strategies

    Utilize detailed fracture width data to develop more effective production strategies, enhancing overall resource recovery and well performance.